
The spectrum analyzer has been a staple of the RF engineering community for over sixty years. Its evolution has kept pace with technological innovations such as cellular networks, wireless protocols, and complex modulation techniques. As analyzers adopted new functionalities and capabilities, the traditional terminology and classification of these devices became more diverse, sometimes leading to confusion. On top of this, analysis in the frequency domain has grown beyond traditional spectrum analysis to include additional types of instruments such as RF recorders, vector network analyzers, and – as I’ll highlight in this blog – oscilloscopes. Let’s look at how the spectrum analyzer has evolved into the signal analyzer and how it relates to the modern oscilloscope.
SWEPT-TUNED SPECTRUM ANALYZERS


The swept-tuned spectrum analyzer operates on the principal of adjusting (or tuning) a resolution bandwidth filter through a range of frequencies and measuring the amplitude of the signal at each step. The block diagram seen in Figure 1 illustrates the path from input to display. You may notice it looks very similar to the super-heterodyne technique of an AM radio, except the sweeping is automated instead of manually done with a dial, and the output is a display instead of a speaker. This type of design leverages a traditional analog RF architecture and requires a relatively small manufacturing cost. However, due to its nature of “sweeping” through the spectrum, this type of analyzer is only suitable for stable, unchanging signals.
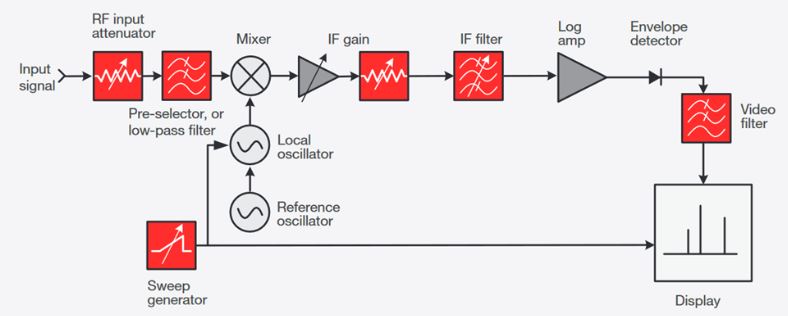
Figure 1: Swept-tuned spectrum analyzers used a super-heterodyne design to capture and display amplitude of various frequencies within the range of the instrument.
FAST FOURIER TRANSFORMS AND THE JOURNEY TO REAL-TIME
The first attempt to cover a wider spectrum over a single analysis acquisition involved designing multiple filters into the instrument, each covering a unique frequency range. The instrument performed parallel analyses over the range of the filters, removing the variability of the signal changes over the course of a sweep. While this technique was effective, the cost of installing many parallel filters warranted a more feasible approach.
Over time, many components used in a spectrum analyzer shifted from the analog to the digital realm. With the incorporation of analog-to-digital converters (ADCs) and digital processors, spectrum analyzers could now perform operations on digitized data, providing more freedom and flexibility. What once required multiple acquisitions now required only one by sampling signal data in the time domain with a single acquisition and applying a Fourier transform (FFT) to the data. This led to the industry calling these instruments “FFT analyzers”. This new method enabled an additional capability – the ability to capture both magnitude and phase data (vectors), which is essential for analyzing complex, modulated RF signals. This vector analysis capability led to some manufacturers to refer to these instruments as “vector signal analyzers,” though when we say “VSA” at Keysight, we’re referring to our Vector Signal Analysis software (more on that later).
Despite the significant advancements made by incorporating digital FFTs into the spectrum analyzer, it still suffered from “blind time” between acquisitions due to the time it took to post-process the FFTs after collecting the data. With the advent of efficient digital signal processing (DSP) in the 1990s, the FFT analyzer evolved into the “real-time spectrum analyzer,” which got its name due to its rapid, continuous spectrum display updates. Figure 2 illustrates an example architecture incorporating digital processing.
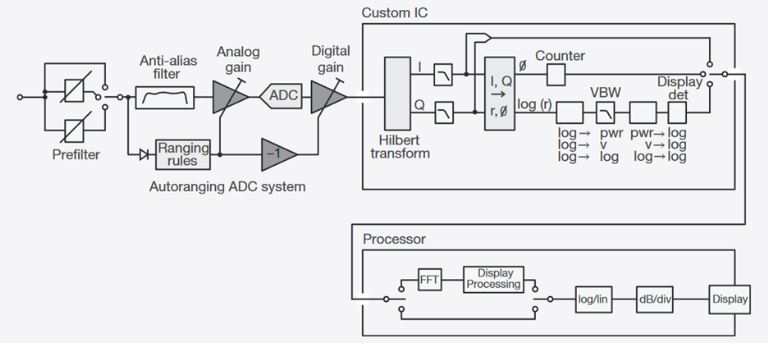
Figure 2: Availability of processors and advanced digital signal processing advanced the capabilities of FFT-based spectrum analyzers.
Today, modern analyzers fall into two categories: devices that only measure magnitude against frequency (spectrum analyzers or basic spectrum analyzers), and devices that can measure magnitude and phase information against frequency (signal analyzers), allowing analysis and demodulation of complex signals. Either type of device may include swept-tuned and FFT-based modes of operation, and if an instrument can show a continuous analysis of the spectrum without any gaps in time, such as Keysight’s PXA signal analyzer in Figure 3, it’s considered to have “real-time spectrum analysis” (RTSA) capability.
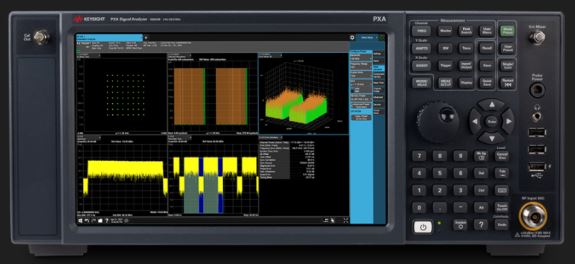
Figure 3: Keysight’s N9030B PXA signal analyzer features a 50 GHz frequency range with the ability to analyze up to 510 MHz of real-time spectrum analysis.
IT’S A SCOPE! IT’S AN ANALYZER! IT’S… BOTH!
Modern oscilloscopes use an architecture that conditions, samples, processes, and displays a signal in the time domain. Typically, scope users are concerned with time-based measurements such as rise time, eye height, and overshoot, or they might want to correlate analog and digital signals. So, why have oscilloscopes traditionally been limited to the time domain?
The data obtained right after the ADC is basically the same whether it’s digitized in an oscilloscope or in a signal analyzer — data samples are in the time domain and await further processing. An oscilloscope traditionally continues to operate in the time domain, while a signal analyzer converts the data to the frequency domain. Because of the similarity in techniques, an opportunity presented itself for us to add a functionality to the oscilloscope that converts the data to the frequency domain in much the same manner as a signal analyzer.
Keysight is proud to offer oscilloscopes with spectrum analysis functionalities, but before you throw out your signal analyzer, it is best to understand that the frequency-domain capabilities of an oscilloscope will vary from model to model. When you’re considering a scope for spectral analysis, be sure to evaluate these important characteristics:
- FFT methodology – how is the FFT being performed? Almost every scope has an FFT function living within its list of “math” functions. However, it generally takes dedicated hardware to process the incoming data fast enough to continuously monitor a spectrum.
- Frequency range – what range of center frequencies is the oscilloscope capable of analyzing? Some oscilloscopes may feature center frequency ranges beyond the bandwidth of the oscilloscope.
- Analysis bandwidth – what frequency span is available around the center frequency, and how does that vary with the number of channels being used?
- Real-time spectrum analysis – does the instrument offer gapless, real-time analysis with a 100% point of intercept (POI), ensuring transient events are captured?
- RF characteristics – how does the front end perform in terms of sensitivity, amplitude accuracy, phase noise, error vector magnitude (EVM), and spurious-free dynamic range (SFDR)?
- Triggering – does the instrument support time-domain triggers and/or frequency-domain triggers?
- Analysis tools – does the instrument have the capability to perform vector and digital demodulation? Can it perform advanced analysis on cellular, wireless, and digital video signals? Can data be exported to external software for further analysis?
Keysight’s MXR-Series real-time oscilloscope (Figure 4, left) includes options for spectrum analysis through digital down-conversion (DDC) and real-time spectral analysis (RTSA). In DDC mode, the scope will capture spectral data in the form of IQ streams, allowing you to save, export, and analyze the data with advanced tools such as Keysight’s 89600 Vector Signal Analysis software (Figure 4, right). In RTSA mode, the data is presented visually, but not saved, to ensure gapless monitoring and 100% probability of intercept – a great way to catch rare, intermittent events on the screen.
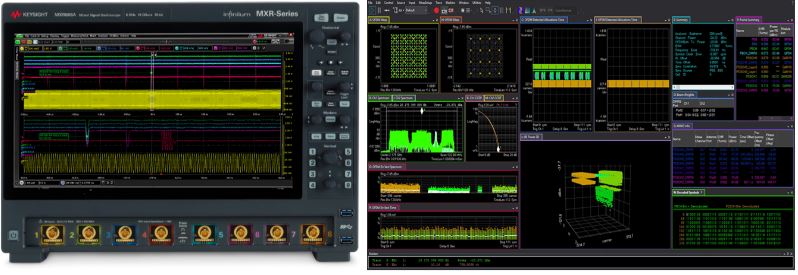
Figure 4: Keysight’s MXR Series oscilloscope (left) features spectrum analysis up to a 6 GHz center frequency with both real-time spectrum analysis of up to 320 MHz of bandwidth and IQ data streaming up to 2 GHz of bandwidth. IQ data can be exported to 89600 VSA software (right) for advanced demodulation, vector analysis, and standards-specific measurements.