


Oscilloscopes sample signals as they change over time and then plot those signals on a display. The amplitude of the signal is plotted on the vertical axis and time is displayed on the horizontal. Modern digital oscilloscopes can display signal changes that occur over time in as long as hours or as short as billionths of a second. To become proficient in analyzing waveform traces, you must train your eyes to always look at four characteristics of the waveform:
- Amplitude (looking along the vertical axis)
- Time (looking along the horizontal axis)
- Waveform shape, and distortion of waveform shape
- Waveform disturbances, particularly from outside sources
There are 10 common waveform variations to look for, including:


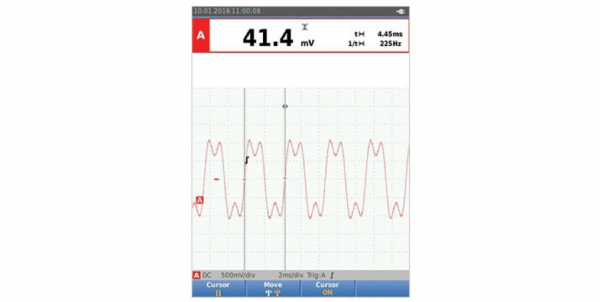
- Not symmetrical, shape
Repetitive waveforms should be symmetrical. That is, if you were to print the traces and cut them in two like-sized pieces, the two sides should be identical. A point of difference could indicate a problem.
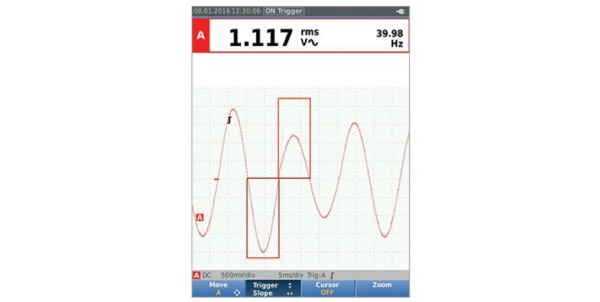
If the two components of the waveform are not symmetrical, there may be a problem with the signal.
- Rise and fall, edges
Particularly with square waves and pulses, the rising or falling edges of the waveform can greatly affect the timing in digital circuits. It may be necessary to decrease the time per division to see the edge with greater resolution.
Use cursors and the gridlines to evaluate the rise and fall times of the leading and trailing edges of a waveform.
- Horizontal cursors, amplitude
Verify that the level is within the operating specifications of the circuit. Also check for consistency, from one period to the next. Monitor the waveform for an extended period of time, watching for any changes in amplitude.
Use horizontal cursors to identify amplitude fluctuations.
- DC/amplitude offsets
DC-couple the input and determine where the ground reference marker is. Evaluate any dc offset and observe if this offset remains stable or fluctuates.
Evaluate waveform DC offsets.
- Period time changes/wave shape
Oscillators and other circuits will produce waveforms with constant repeating periods. Evaluate each period in time using cursors to spot inconsistencies.
Evaluate period-to-period time changes.
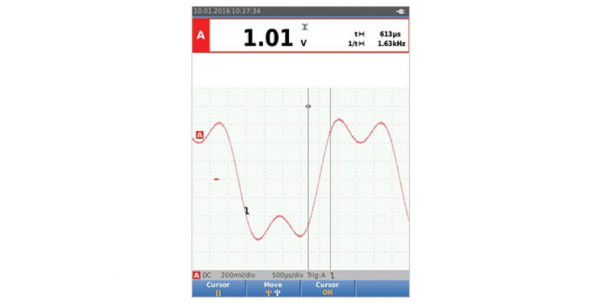
- Transient glitch/waveform anomalies
Here are typical anomalies that may appear on a waveform, along with the typical sources of such anomalies.
A transient is occurring on the rising edge of a pulse.
- Random noise/transients or glitches
When waveforms are derived from active devices such as transistors or switches, transients or other anomalies can result from timing errors, propagation delays, bad contacts or other phenomena.
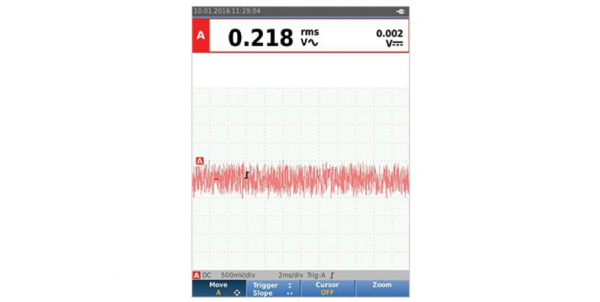
A ground reference-point measurement showing induced random noise.
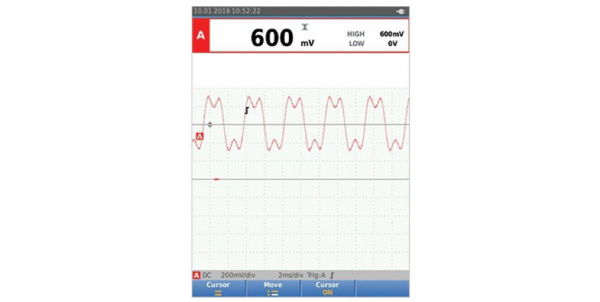
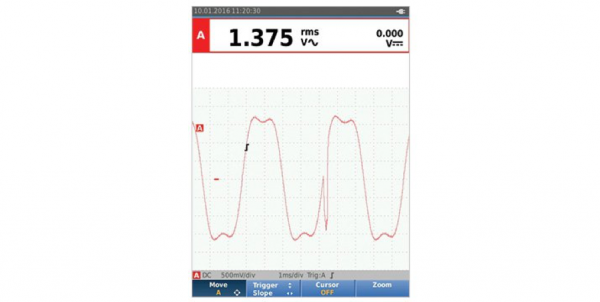
- Excessive ringing
Ringing can be seen mostly in digital circuits and in radar and pulse-width-modulation applications. Ringing shows up at the transition from a rising or falling edge to a flat dc level. Check for excessive ringing, adjusting the time base to give a clear depiction of the transitioning wave or pulse.
Excessive ringing occurring on the top of the square wave.
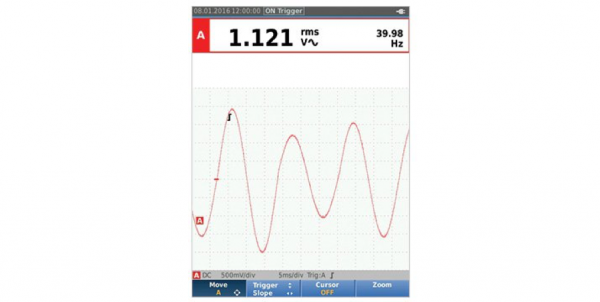
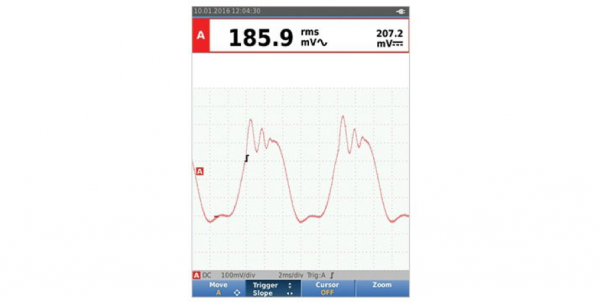
- Momentary change/fluctuation
Momentary changes in the measured signal generally result from an external influence such as a sag or surge in the main voltage, activation of a high-power device that is connected to the same electrical circuit, or a loose connection. Use the ScopeRecord function and Event Capture mode of the ScopeMeter Test Tool to monitor the signal over long periods of time to detect the elusive momentary events.
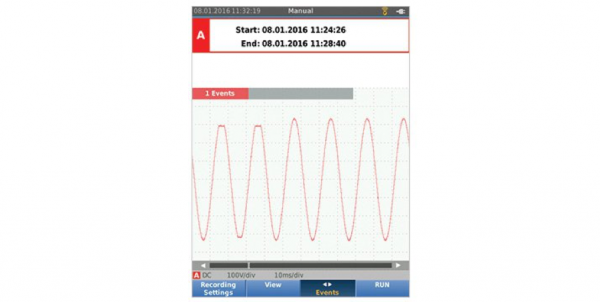
A momentary change of approximately 1.5 cycles in the amplitude of the sinewave.
- Drift
Drift—or minor changes in a signal’s voltage over time—can be tedious to diagnose. Often the change is so slow that it is difficult to detect. Temperature changes and aging can affect passive electronic components such as resistors, capacitors and crystal oscillators. One problematic fault to diagnose is drift in a reference dc voltage supply or oscillator circuit. Often the only solution is to monitor the measured value (V dc, Hz, etc.) over an extended time.
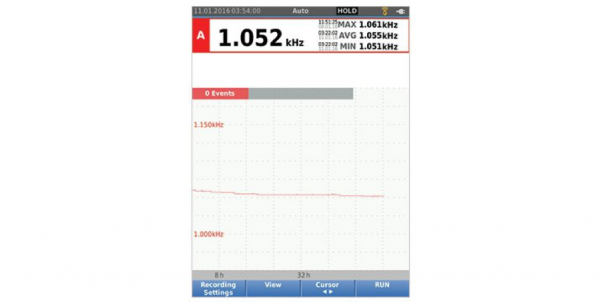
A momentary change of approximately 1.5 cycles in the amplitude of the sinewave.