


Imagine a world in the next few decades where your grandchildren didn’t know about the word hospital and all your health information was recorded and monitored remotely through sensors. Imagine your home equipped with different sensors to measure air quality, temperature, noise, light, and air pressure, and, based on your personal health information, systems adjust the relevant environmental parameters to optimize your well-being at home. Analog Devices holds a unique position to make this happen by providing sensors, software, and algorithms that complement each other, which increases its share of the digital health market.
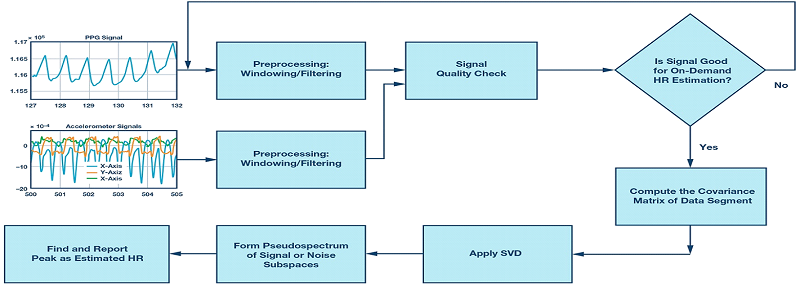
Heart rate (HR) monitoring is a key feature in many existing wearable and clinical devices. These devices generally measure photoplethysmography (PPG) signals, which are obtained by illuminating human skin using LEDs and measuring intensity changes due to blood flow in the reflected light by a photodiode. The PPG signal morphology is similar to the arterial blood pressure (ABP) waveform, which makes this signal popular within the scientific community as a potential noninvasive HR monitoring tool. The periodicity of the PPG signal corresponds to cardiac rhythm. Therefore, HR can be estimated from the PPG signals. However, the HR estimation performance can be degraded by poor blood perfusion, ambient light, and, most importantly, motion artifacts (MA).1 Many signal processing techniques have been proposed to remove the MA noise, including the ADI motion rejection and frequency tracking algorithm, by using a three-axis acceleration sensor placed close to the PPG sensor. When there is no motion, it is desirable to have an on-demand algorithm provide a fast and more accurate estimate of the HR to tracking algorithms. This article adapts the multiple signal classification (MUSIC) frequency estimation algorithm for high precision, on-demand HR estimation using the PPG signals from the wrist, using the ADI healthcare watch platform using the block diagram in Figure 1. The details of the figure will be explained in later sections.


What Does a PPG Signal from ADI’s Healthcare Watch Look Like?
As light is emitted by the LED, blood levels and tissues absorb various amounts of photons, causing different detections sensed by the photodetector. The photodetector measures the variations in blood pulsations and outputs a current that is then amplified and filtered for further analysis. Figure 2a shows a general PPG signal consisting of alternating current (ac) and direct current (dc) components. The dc component of the PPG waveform detects the optical signal reflected from the tissue, bone, and muscle, and also the average blood volume of both arterial and venous blood. The ac component, on the other hand, demonstrates changes in the blood volume that occurs between the systolic and diastolic phases of the cardiac cycle, where the fundamental frequency of the ac component depends on the HR. Figure 2b is the PPG signal from the ADPD107 watch, which was introduced in previous Analog Dialogue articles. The goal of the ADI multisensory watch is to measure multiple vital signs on the human wrist. The ADI watch has PPG, an electrocardiogram (ECG), electrodermal activity (EDA), an accelerometer (ACC), and temperature sensors.
Now let’s have a close look into the similarity of the PPG and ABP waveforms. The ABP waveform is created due to the ejection of blood from the left ventricle. The main pressure travels down the systemic vascular network and reaches several sites, causing reflection due to significant changes in arterial resistance and compliance. The first site is the juncture between the thoracic and abdominal aorta, which causes the first reflection, commonly known as the late systolic wave. The second reflection site is the juncture between the abdominal aorta and common iliac arteries. The main wave is reflected back once again, which makes a small dip, called the dicrotic notch, which can be observed between the first and second reflections. There are other additional minor reflections, which are smoothed in the PPG signals.2 The focus of this article is on the HR estimation, which only depends on the periodicity of the PPG signals and the exact morphology of the PPG is not taken into consideration for the purpose of this algorithm.
Preprocessing of PPG Signals
The susceptibility of the PPG signal to poor blood perfusion of the peripheral tissues and motion artifact is well known.1 In order to minimize the influence of these factors in the subsequent phases of the PPG analysis for HR estimation, a preprocessing stage is required. A band-pass filter is required to remove both high frequency component (such as power sources) of the PPG signals, as well as low frequency components, such as changes in capillary density and venous blood volume, temperature variations, and so on. Figure 3a shows a PPG signal after filtering. A set of signal quality metrics is used to find the first window of PPG signal appropriate for the on-demand algorithm. The first check involves the ACC data and the PPG signal to determine whether a segment of motion free data can be detected—then, the other signal quality metrics are measured. Estimates from such a window of data are rejected by the on-demand algorithm if there is motion above a certain threshold of the absolute value of the ACC data in three directions. The next signal quality check is based on certain autocorrelation having features of the data segment. One example of the autocorrelation of the filtered PPG signal is shown in Figure 3b. Autocorrelation of acceptable signal segments exhibits properties such as having at least one local peak and not more than a certain number of peaks corresponding to the highest possible HR; having the local peaks in a descending order with increasing lags; and a few others. Autocorrelation is only computed for lags that correspond to meaningful heart rates within a margin of range, from 30 bpm to 220 bpm.
When enough data segments pass the quality checks consecutively, the second stage of the algorithm extracts an accurate HR using the MUSIC-based algorithm.
MUSIC-Based Algorithm for On-Demand HR Estimation
MUSIC is a subspace-based method using a model of harmonic signals that can estimate frequency with high precision. When it comes to the PPG signals corrupted with noise, Fourier transform (FT) may not behave well, as we are seeking a high resolution HR estimation algorithm. Also, FT distributes time-domain noise uniformly throughout the frequency domain, limiting the certainty of estimation. It is difficult to observe a small peak in the vicinity of a large peak using FT.4 Therefore, in this study, we used the MUSIC-based algorithm for frequency estimation of the HR. The key idea behind MUSIC is that the noise subspace is orthogonal to the signal subspace, so zeroes of the noise subspace will indicate signal frequencies. The following steps show a summary of this algorithm used for the HR estimation:
- Remove the mean and linear trend from the data
- Compute the covariance matrix of the data
- Apply the singular value decomposition (SVD) to the covariance matrix
- Compute the signal subspace order
- Form the pseudo spectrum of the signal or noise subspaces
- Find the peaks of the MUSIC pseudo spectrum as the HR estimate
MUSIC has to apply a singular value decomposition and has to search spectral peaks in the full range of frequencies. Let’s look at some math in order to make the above steps more clear. Assume a window of length m of the filtered PPG signal, which is denoted as xm and m ≤ L (with L being the total samples of the filtered PPG signal in a given window). Then, the first step is to form the sample covariance matrix as follows:
Then, an SVD is applied to the sample covariance matrix as given below:
where U is the left eigenvectors, Λ is the diagonal matrix of the eigenvalues, and V is the right eigenvectors of the covariance matrix. The subscripts s and n stand for the signal and noise subspaces. As we mentioned before, the MUSIC-based algorithm is modified for HR estimation using prior knowledge that the signal has passed the signal quality checking stage—so the only frequency content in the signal after the preprocessing step is the HR frequency. Next, we form the signal and noise subspaces, assuming the model order only contains one single tone, as follows:
where p = 2 is the model number. The frequencies within the meaningful HR limits are considered only. This reduces the computations significantly and makes it feasible for real-time implementation for embedded algorithms. The search frequency vector is defined as
where k is the frequency bin within the frequency range of interest for HR, and L is the window length for the data in xm (t). Then, the following psesudospectrum takes the noise subspace eigenvectors to find the peaks of the MUSIC as follows.
The word psesudospectrum is used here because it indicates the presence of sinusoidal components in the studied signal, but it is not a true power spectral density. One sample result of the MUSIC-based algorithm on a 5 second window of data is given in Figure 4, which shows a sharp peak at 1.96 Hz, and which translates to 117.6 bmp HR.
Results of the MUSIC-Based On-Demand Algorithm for HR Estimation
We have tested the performance of this algorithm on a dataset comprising of 1289 test cases (data1) and at the beginning of the data the test subjects are asked to stand at rest. Table 1 illustrates the result of the MUSIC-bassed algorithm and indicates if the estimated HR is within 2 bpm and 5 bpm of the reference (ECG), as well as the 50th percentile (median) and 75th percentile of the estimation times. The second row of Table 1 shows the performance of the algorithm when there is periodic motion (such as walking, jogging, running) over a dataset of 298 test cases (data2). The algorithm is considered to be successful if either the data is rejected as unreliable by sensing the motion or by accurately estimating the HR despite the motion. In terms of memory usage, assuming a buffer size of 500 (that is, 5 sec at 100 Hz), the total memory needed is around 3.4 kB with 2.83 cycle per call for the frequency range of interest (30 bpm to 220 bpm).
Metric 2 bpm Accuracy 5 bpm Accuracy 50th Percentile 75th Percentile
Accuracy (data1) 93.7% 95.2% 5.00 sec 5.00 sec
Accuracy (data2) 93.4% 94.1% 5.00 sec 5.00 sec
Final Discussion
The MUSIC-based on-demand algorithm is one of the many algorithms proposed in the vital signs monitoring segment of the ADI healthcare business unit. The on-demand algorithm used in our healthcare watch is a different algorithm than the MUSIC-based method discussed here, because it is less computationally expensive. ADI delivers software and algorithm capabilities at both sensor (embedded) and edge nodes that distill data to extract valuable information by sending only the most important data to the cloud and allowing local decision making for our customers and partners. We choose applications where outcomes really matter for our customers and where we have unique measurement expertise. This article just provides a flavor of the algorithms we are working on at ADI. With our existing expertise in sensor design, and our efforts in biomedical algorithm development (both embedded and cloud), ADI will have a unique position to provide state-of-the-art algorithms and software to the global healthcare market.