


Look deep under the covers of any digital chip design flow, and you will find a vast, untapped wealth of information about the health and status of your SoC design. Imagine if you could turn this information—seamlessly and efficiently—into actionable insights that enhance your productivity and, ultimately, the quality of your SoCs.
We are in an environment of growing SoC and system complexity, persistently aggressive market windows, and an increasingly challenging engineering resource landscape. This likely won’t change anytime soon. So, anything that can help you tap into the data richness of your digital design flow could give you an advantage over your competition.


That’s the aim of the Synopsys DesignDash data-visibility and machine intelligence- (MI-) guided design optimization solution. The comprehensive Synopsys DesignDash solution additionally represents a critical expansion of our EDA data analytics portfolio, forming a pre-silicon to post-silicon data continuum and maximizing opportunities for valuable data analysis across the complete design-to-silicon lifecycle. Read on to learn more about how Synopsys DesignDash can help your design team work more productively, efficiently, and effectively.
Better Observability and Visibility for All
The myriad engines that make up the Synopsys RTL-to-signoff design flow operate as a constant interplay–a waltz-like dance, if you will–of golden signoff-enabled analysis (including timing, power, area, IR-drop, and DRCs) alongside targeted, highly tuned optimizations. Their singular goal is to co-enable the achievement of power, performance, and area (PPA) targets as smoothly and efficiently as possible. This constant analysis generates vast volumes of data, much of which is highly unstructured. However, this mass of disconnected data points, when taken together, can provide a detailed understanding of the “health” of the design. For example, where are additional opportunities for design improvement? What can be addressed earlier in the flow to bring this design to closure?
Log files do go some way to expose this data. Still, with the size and complexity of the current crop of designs, only small views into the vast underlying data are possible before they become too unwieldy to comprehend. Engineers, therefore, have long had to try to second-guess what data may be helpful to them and then use proactive data-dumping from the tools to extract what they hope is the necessary information. And then, they might apply multi-tool parsing of traditional data sources, like the log files, to combine and piece together what they eventually need to drive debugging. What has always been missing is a way to amalgamate and connect this data–the deep engine metrics and their associated analysis–into a grand, holistic view. Having a means to, for example, efficiently “connect the dots” between a timing issue in one part of the design and a congestion issue somewhere else would be highly beneficial.
The Synopsys DesignDash solution presents such a holistic view of all project data and then drives it many steps further (Figure 1). The solution efficiently and autonomously siphons metrics data while also intelligently curating the associated analysis data directly from Synopsys’ unique single data model. Then, it transforms and loads the data into always-on, industry-standard databases. Handling flow metrics from a third-party tool is equally simple. With the data available in tool-decoupled databases, searching, filtering, graphing, comparing, and trending are simple, intuitive tasks. As more runs progress, that data–indeed, the data from the entire project team–can also be absorbed, compared, and cross-referenced through a responsive, web-based user interface (UI) and then shared with ease.
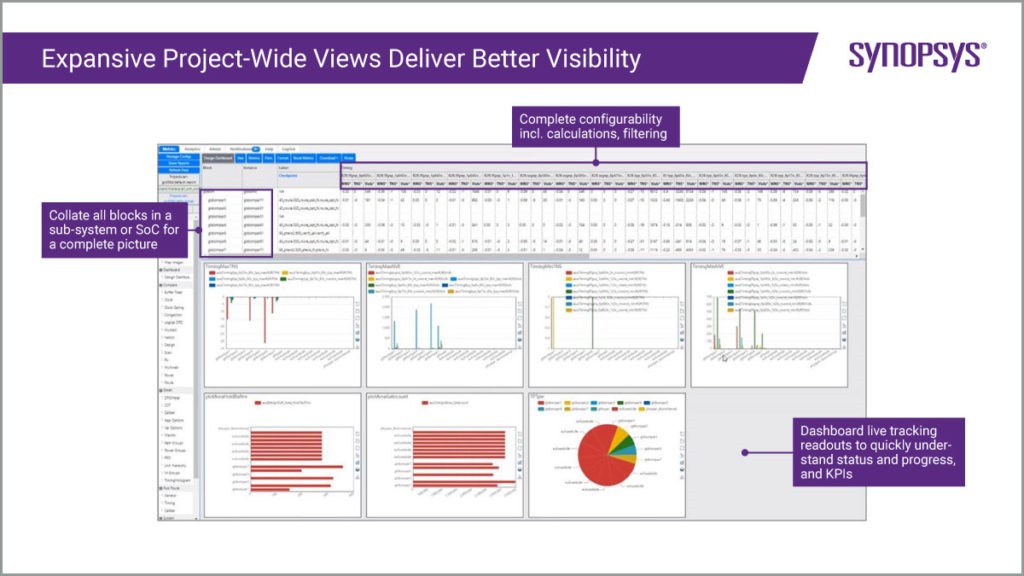
Figure 1: Synopsys DesignDash technology enables comprehensive observability, bringing better progress tracking across blocks, sub-systems, or entire SoCs. Build the right view for your team or organization. Quickly identify areas for additional focus.
This idea of seamless sharing is a central thrust of the Synopsys DesignDash solution. The old, manual way of piecemeal data capture has made the design process extremely opaque. Not having a comprehensive way to measure underlying design processes has made it nearly impossible to improve and more effectively manage them.
A live, 360-degree view of all design activities allows standardization to drive project-wide efficiencies– based on the fact that everything is now being measured. Engineers no longer need to extract data, enter it into spreadsheets, format it (with maybe somewhat arbitrary colors), and paste it into slides to report their daily or weekly progress. How many hours are your team currently spending on this type of task? Too many! Instead, with our unique data-visibility solution, a team-wide dashboard can capture a consistent and comprehensive view that makes status comparison easy, informative, and actionable. Critical, key performance indicators (KPIs) needed for better project management can all be captured in simple-to-build dashboards. Resource efficiency, be that machine, license, or any other metric, is simple to track, manage, and therefore optimize through easy-to-share dashboards. With customizable widgets, you can even bring in external data sources to be combined into arbitrary drill-downs.
Generating Rich Analytics to Reveal True Prescriptive Chip Design Insights
Harvesting and curating the big data is just the start of the story. Synopsys DesignDash technology mines the breadth of incoming data to show not only what is happening–the state of the underlying engines at any point throughout the flow–but also why it is happening. These machine learning- (ML-) based, augmented analytics make it faster and easier to quickly gain a deep, intimate understanding of the design by autonomously classifying design trends, identifying design limitations, and providing guided root-cause analysis across the entire design flow. With the analytics running automatically in the background, it’s like an army of extra engineers performing expert-level debugging and then distilling that real-time analysis into easily consumable (i.e., intuitive, customizable, interactive), cross-comparable visualizations.
How did my critical path evolve structurally through every stage of the flow? What was the dominant reason (logic depth, detouring, layer choice, skew, insertion delay) causing its failure? How does this run compare to my other three experiments? What app option or flow change most likely caused it? Answers to these types of questions and more are quickly resolved as everyone on a team becomes armed with deep domain expertise. It’s a path toward better, more informed, more data-driven decision-making (Figure 2).
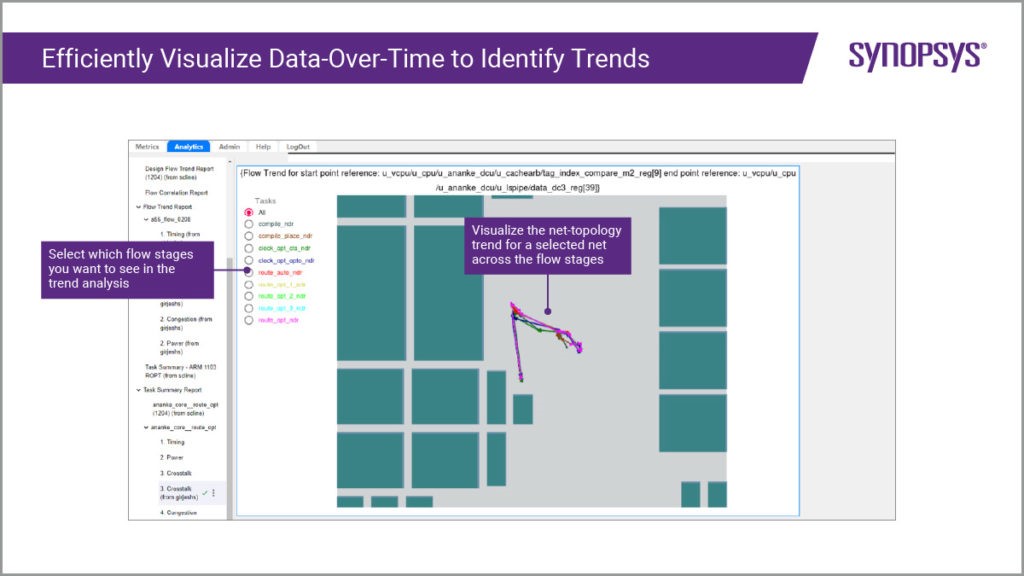
Figure 2: The Synopsys DesignDash solution enables the cross-visualization of data from all flow stages – or even across different design flows – in easy-to-comprehend views to speed design understanding.
The deep, augmented analytics from Synopsys DesignDash technology also opens the door to prescriptive guidance, suggesting to teams some different ways to fix the problems that have been automatically identified (Figure 3). Statistical- and ML-based models that capture how the tool best addresses specific design issues, followed by the generation of tool-consumable scripts to directly target the issues at hand, greatly speed design closure and unlock otherwise untapped PPA.
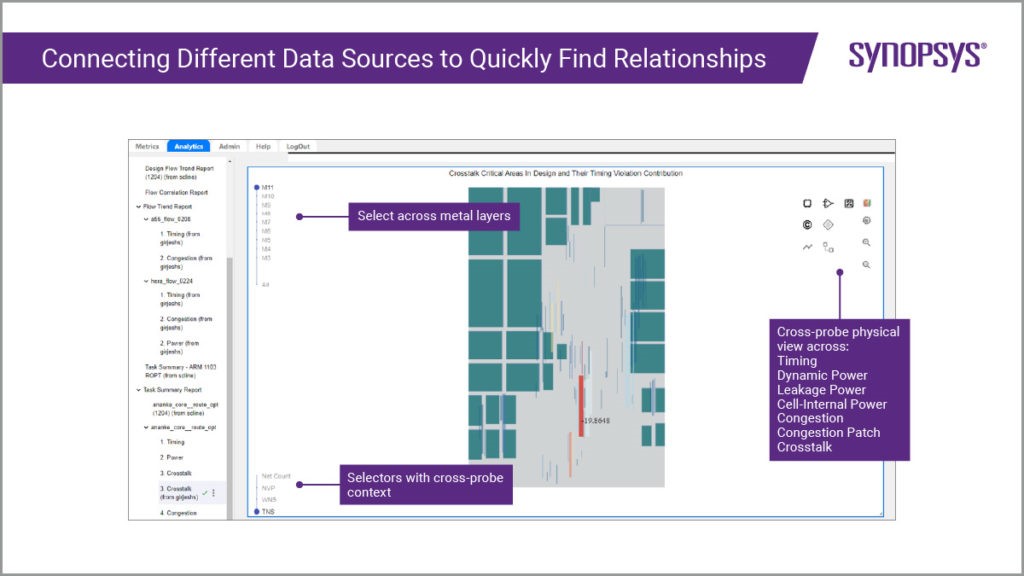
Figure 3: The Synopsys DesignDash solution fuses data from numerous, disparate cross-domain sources into a combined view for seamless cross-probing. This view shows cross-talk timing impact versus physical location.
Helping Silicon Engineering Teams Work Faster
Working hand-in-hand with the Synopsys Digital Design Family of products, the Synopsys DesignDash solution smartly complements the industry-first Synopsys DSO.ai autonomous AI application for chip design. Together, these technologies address the growing shortfalls in productivity that many design teams face today. Through more productive debugging and optimization, Synopsys DesignDash technology accelerates the achievement of more “implementable” designs across a much broader architectural solution space. These more optimized designs form the starting points of the vast, multi-dimensional solution space search provided by DSO.ai technology, significantly speeding the path to truly optimum system PPA. In essence, the Synopsys DesignDash solution will speed the identification of the best mountain in the best mountain range, and the DSO.ai solution will use its many smarts to quickly find the ‘top’ of the highest peak–across a much more comprehensive set of chip design goals.
Author: Mark Richards Sr. Staff Product Marketing Manager, Synopsys Silicon Realization Group.