

The Need for Coverage Mapping
When rolling out any new wireless communications network, an essential part of the process is validating that users have good signal coverage across the entire geographic service area. For commercial networks, such as cellular operators, dropped calls due to poor signal coverage results in customer frustration and churn. For first responder networks, including TETRA and P25 systems, poor coverage can result in potential danger to life if paramedics or law enforcement officers lose communications with their control centers.


The expected coverage and performance of a new network is typically modelled at the design stage, with base stations positioned strategically to ensure total geographic coverage. Once installed, it is necessary to validate that real world coverage matches the modelling expectations. Geographic features such as hills, forests, and tall buildings can result in unexpected “no coverage” zones which need to be identified and additional base stations of repeaters need to be added.
The installation of a communications base station requires many layers of test. During the first build out, the RF cables and antennas will require line sweeping which tests the transmitter after installation this will verify that transmit power has been set within tolerance and that spurious and harmonic emissions meet local or national regulations. Modulation quality metrics such as error vector magnitude (EVM) and channel bandwidth are regularly part of the acceptance test. Finally, when the base station has been brought on-line, the geographic coverage needs to be measured against the predicted models.
Each of these test elements require specific test instruments such as, cable and antenna analyzers, spectrum analyzers, and drive test solutions. Today, integrated instruments such as the Anritsu’s Field Master Pro MS2090A can perform many of these measurements in a single instrument.
The Field Master Pro MS2090A spectrum analyzer has an optional built-in coverage mapping feature that enables a common instrument to be used for transmitter signal quality testing and coverage mapping.
Coverage Mapping in the Field Master Pro MS2090A
The coverage mapping option on the Field Master Pro MS2090A provides a flexible and convenient tool that plots fundamental transmitter parameters, such as channel power or received signal strength indicator (RSSI), on a digital map. The color of the individual breadcrumbs shown on the map indicates the signal level strength at that location. Digital maps are downloaded into the memory of the Field Master Pro MS2090A.
The instrument is then placed in a vehicle with a compatible omnidirectional antenna on the roof. The vehicle then drives around the area of interest. During the drive, breadcrumbs representing the signal power are plotted on the instruments map screen real-time.
System Components
Typically, coverage mapping is surveying a wide geographic area. Mapping is done using a car or truck driving a pre-planned route on public roads. When mapping a city center or campus it may not be possible to drive a vehicle in the survey area. In this case, the instruments may be put in a back pack and walked around the area to be mapped.
Field Master Pro MS2090A with:
- Option 31 – GPS receiver
- Option 431 – Coverage mapping
- 40-207-R – Automotive DC/DC power adaptor
- 2000-1647-R – Magnetic mount omnidirectional antenna (698 MHz to 2700 MHz plus GPS)
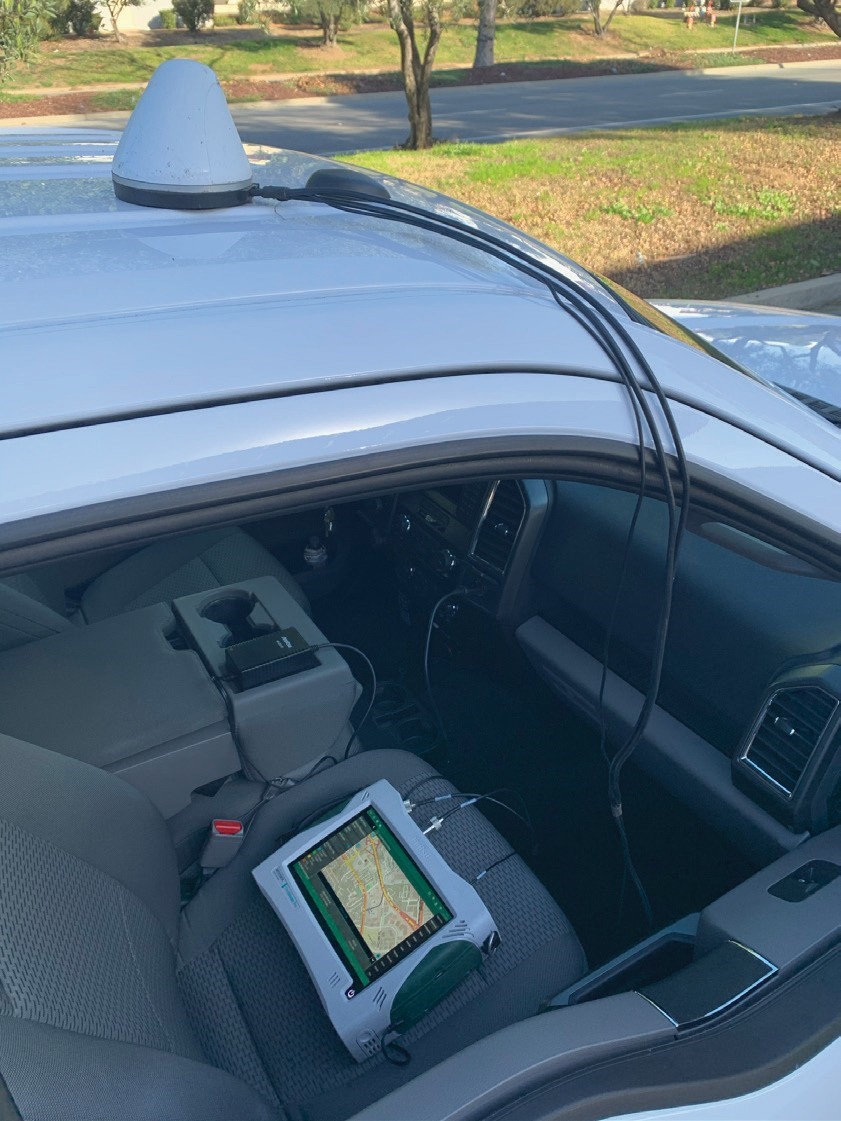
Field Master Pro MS2090A in a Vehicle with a Magnetic Mount Omnidirectional Antenna Connected to DC Power Supply
Downloading Maps into the Field Master Pro MS2090A
Before starting a coverage mapping drive, it is necessary to download a digital map of the target area into the Field Master Pro MS2090A memory. The Field Master Pro MS2090A coverage mapping option includes an embedded, low detail, world base map. The MAP TOOL provides access to downloadable, high detailed map tiles for offline use during signal mapping. Make sure the Field Master Pro MS2090A is connected to the internet either through the Wi-Fi or Ethernet ports. Once connected to the internet, maps are downloaded directly from a website into the instruments memory.
Press the SYSTEM menu icon in the top left of the instrument display, followed by TOOLS > MAP TOOL. This will present an interactive map screen as shown below. To simplify downloading of maps, it is recommended that a GPS antenna is connected and GPS lock is achieved. The GPS lock icon will be highlighted in the bottom right of the screen when GPS lock has been attained. Tapping this icon will center the map on your current location.
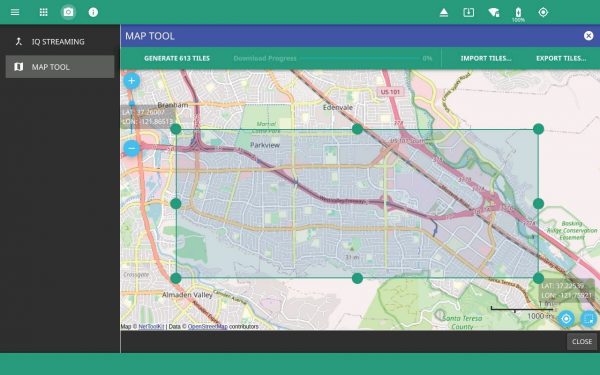
Screen for Downloading High Resolution Digital Maps Directly from the Internet
The Field Master Pro MS2090A touch screen offers the same multi-touch map manipulation that is experienced on a smartphone. The map zoom tool is used to increase (+) or decrease (-) zoom area. The user can also drag the zoom level indicator up or down or you can pinch your fingers together and drag them on the screen to change zoom level.
Tap the MAP TILE SELECTION icon to open the tile selection window, then use pinch motion to highlight the area for the required detailed map. When the required area has been highlighted, tap GENERATE ### TILES.
The top of the screen indicates the number of map tiles that will be generated for the currently selected area. Touch this button to generate the map tiles and add them to the current map tile storage. A maximum of 1,000 tiles can be downloaded in one go and a total of 5,000 tiles can be downloaded.
The IMPORT TILES icon opens the instrument file system which allows you to select previously downloaded tiles from internal or external memory. The EXPORT TILES icon opens the file system so you can export downloaded tiles.
Configuring the Coverage Mapping Measurement
Select the MEASURE menu and then set MEASUREMENT type to Coverage Mapping in the drop down selection to prepare the Field Master Pro MS2090A for coverage mapping measurements in spectrum analyzer mode.
The screen will now show a global map of the world. If the instrument has a GPS lock, press the GPS icon in the bottom right of the map to zoom into your current location. Scale the map with pinch gesture to display the area for the planed drive area. The instrument must have GPS lock for the option to work.
Press the MEASURE SETUP menu to configure the drive parameters.
The MAP MODE menu offers three fundamental measurements for the coverage mapping drive:
- Channel Power measures the total power in the target signal. When channel power is selected, the FREQ SPAN menu should be used to set the center frequency and span of the Field Master Pro MS2090A that is setup for the signal under test. The AMPLITUDE menu sets the maximum signal level that is expected during the drive. A -30 dBm is the suggested reference level for most drives.
- RSSI puts the Field Master Pro MS2090A into zero span and measures the power in the instrument IF with the bandwidth of the selected resolution bandwidth (RBW) filter. This will be 40 MHz in the default condition. In RSSI mode, measurements are available at the fastest possible rate.
- Spectral Density is most commonly used when power needs to be measured at international borders. Should a network operator believe that signals from an adjacent country’s network are interfering with their own network, the regulatory authorities typically require accurate measurement results in dBm/m2/Hz. The coverage mapping option can be used to plot the spectral density along the border.
When spectral density has been selected, select the AMPLITUDE menu and then FIELD STRENGTH. Enable the FIELD STR setting. It is now necessary to apply the correction factor for the selected antenna. Press the ANTENNA soft key and select the correction factor from the available options for the accessory antenna in use, or import a .CSV antenna correction file if using an antenna from an alternative supplier.
When on a coverage mapping drive, measurements can be taken at fixed time intervals or fixed distance intervals. Fixed time can be useful if the signal is varying with time at a fixed location, but for most users the fixed distance mode is preferred. The fixed distance mode feature prevents multiple measurements to be taken at the same location. This can occur when the vehicle is stopped at a road junction or traffic signal. Setting REPEAT TYPE to distance and a repeat distance of 25 meters is advised for most drives.
Five signal strength levels can be defined and users can set the breadcrumb colors for the range of powers that are expected to maximize power level resolution seen on the map.
Completing the Coverage Mapping Drive
Once the measurement has been configured, the instrument should be placed securely on the passenger seat using a safety bracket, if available. A 2000-1647-R magnetic mount antenna is placed on the roof of the vehicle with the RF cables routed through the passenger window. This antenna integrates both GPS and broadband antennas that cover most land mobile radio (LMR) and cellular bands. The GPS cable is then connected to the GPS input on the Field Master Pro MS2090A and the broadband antenna cable is connected to the spectrum analyzer RF input.
To start the measurement, in the MEASURE menu simply tap START MEAS. Channel power measurements will be made at the distance interval, which was configured during the set up process. The measurement will be displayed in real-time on the instrument touch screen digital map. There is no practical limit to the drive length, but it is sensible to stay within the area of the downloaded high resolution map tiles. Once the drive route is complete, tap STOP MEAS.
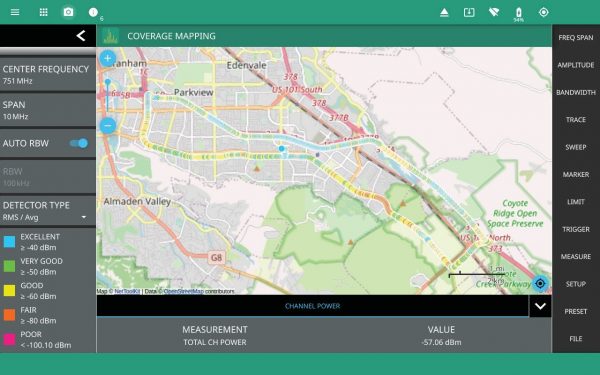
A Typical Coverage Drive Map Result Highlighting Different Channel Power Levels along the Route
When the drive has been completed, results can be saved to the instrument memory in a number of formats.
- Setup file saves the Field Master Pro MS2090A measurement configuration so that the mapping drive can be run again using the same configuration at a later date without having to re-enter all of the parameters.
- Measurement file saves the results data, which enables drives to be recalled at a later date onto the instrument screen.
- Keyhole Markup Language (KML) file saves the results data in a KML format that can be opened in Google Earth and other PC mapping applications.
- Screenshot captures the current instrument screen image and any open menus.
Analyzing the Data
Saved results from a coverage mapping drive can be opened on the instrument display with the Anritsu Field Master Pro MS2090A PC software and on third party mapping applications such as Google Earth.
To view results on Google Earth, they must have been saved in a KLM format. Launch Google Earth and open the KLM file from your file manager.
The same drive shown in the screen image above looks like the below image when displaying the full route.
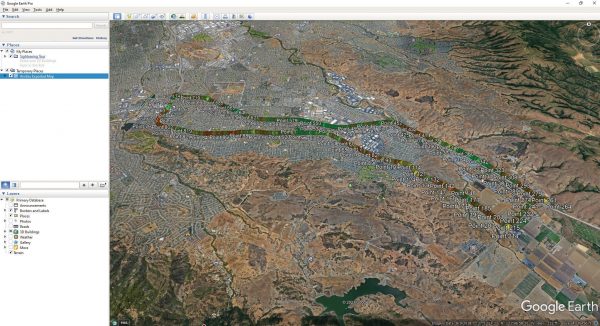
The Full Mapping Drive Displayed in Google Earth
Any area of the drive can be analyzed in greater detail using the zoom slider on the right side of the screen.
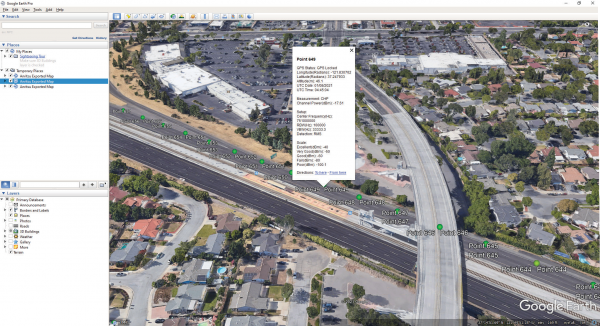
Individual Measurement Results Displayed in Detail on Google Earth
By zooming in and clicking on a measurement point, full details of the measurement at that location are displayed in a pop-up frame. In the above image, the precise GPS location and channel power of 17.61 dBm are recorded. This is a very high over the air channel power result that can be investigated in more detail. Using the STREET VIEW feature of Google Earth and positioning the Pegman avatar (yellowish-orange-colored character, used to help you navigate through Street View) on the street at the location of the high channel power measurement, a cellular base station is clearly visible
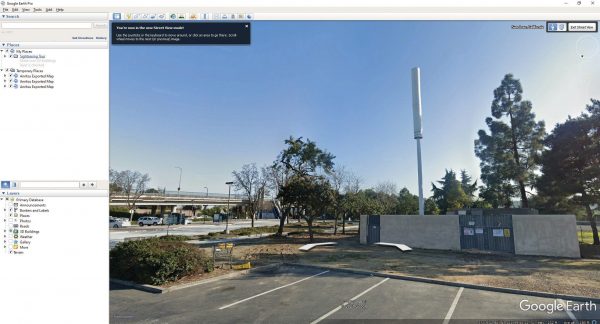
A Cell Base Station Clearly Visible Using Google Street View at the Location of a High Channel Power Result
Summary
Coverage mapping measurements are a powerful tool to confirm that the communications network provides robust communications to all users. Results can quickly identify potential areas where coverage gaps may appear and enables operators to fill those coverage gaps to maintain customer satisfaction. Freely available analysis applications such as Google Earth can provide further insight into network coverage and even identify the locations of transmitter sites.
The Anritsu Field Master Pro MS2090A provides comprehensive coverage mapping capability in an instrument that can also be used for transmitter quality measurements and interference hunting, making it an ideal instrument for network installation and maintenance.